Purpose:
To establish a better methodology for calculating precision of an approved instrument in service.
To apply CFS methodology using control checks re calculation of uncertainty of measurement in blood/urine analysis to evidentiary breath testing.
(Please note that these examples are provided for the purpose of education and discussion among defence lawyers and experts only, these images should not be reproduced. No attempt should be made to use them in Court. The original transcript and exhibits would have to be obtained from the Court.)

Cross-examination of CFS expert:
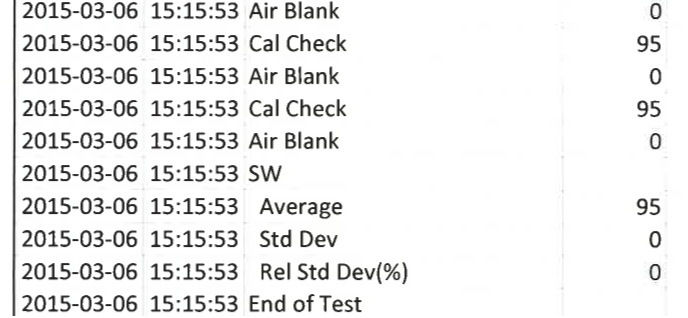
Q. All right. Let’s try and use 50 instead of 2. You would agree with me, 50 is a whole lot better than 2 in terms of determining accuracy and precision of the – of an instrumental system. A. I’m in your hands. You can do whatever you like. Q. All right. Let’s start then, with March the 6th, 2015. A. Yes. Q. And we – during the I-T-Ps. A. So, you counted backwards from.... Q. Counted back 50. A. Counted back 50. Okay. Q. Counted back 50, starting with the – the two wet bath simulator solution checks... A. Yes. Q. ...of – that resulted in 95. Now have you got a copy of this document? A. No, I do not. Thank you.
Q. I’m going to give it to you to compare. And then the very next control test on this instrument – oh, and by the way, that was in the RIDE truck, these cal-checks, right? A. That’s the location that’s.... Q. Shown in the data. A. Yes. Q. Right. The very next one.... A. And some other ones show a 4 District. Q. All right. A. So, it’s obviously gone to a police detachment.


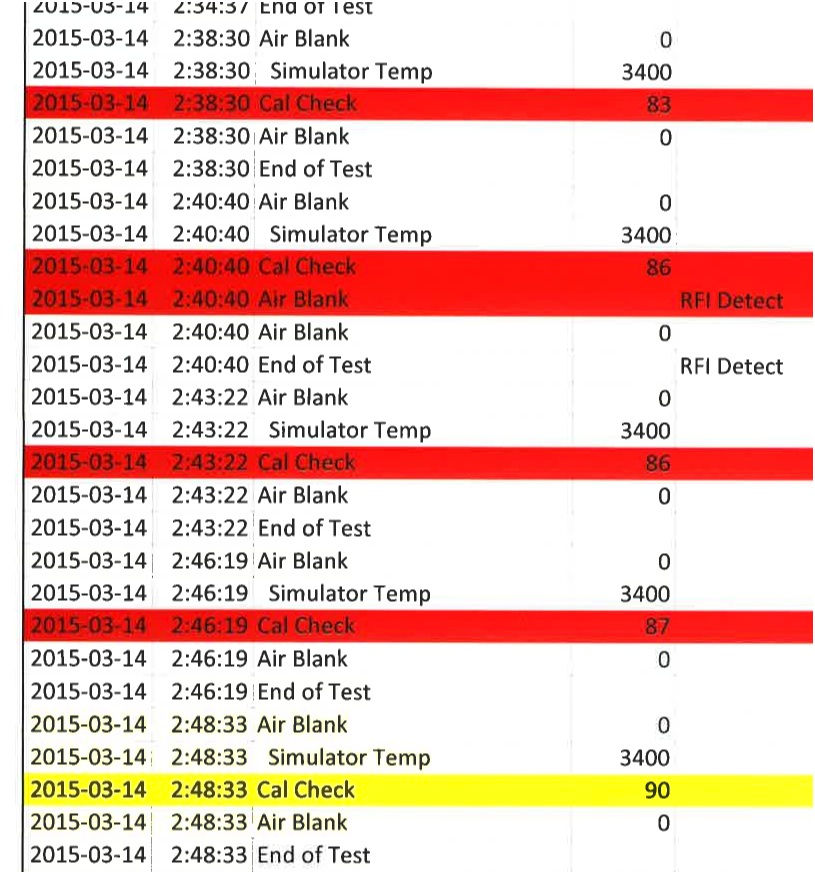
Q. All right, so the 3rd one, in the group, in the spreadsheet that I’ve shown you, number is 89? A. Yes. Q. All right, and the time on that one is at – is on March the 14th, at 2:34:37. A. Yes.

Q. Right? And then the next one, is an 89, on March the 14th, 2015 at 2:38. A. I need something to – I’m just going to use this. There we go. Okay. Yes. Q. All right. So, it may be faster if we just simply have you skim down the pages, starting with March the 6th, 2015 and if you want to call out the call checks and the temperatures that you see in the Cobra data, and let’s just compare it with the – the spreadsheet that I’ve given you. Just tell us where you’re starting.

A. All right, at March 14th, 2015 at 2:34:37 cal-check of 89. Q. Yes. A. At 2:38:30 a cal-check of 83.
Q. Yes. A. At 2:40:40, 86. Q. Yes. A. 2:43:22, 86. Q. Yes. A. 2:46:19, 87. Q. Yes. A. 2:48:33, 90. Q. Yes. A. Oh, and all the temperatures are 34. Q. Yes. A. And just let me quickly.... Q. The next one.... A. I’m trying to save some time here. So, um, 2:52:14, 89. Q. Yes. A. 3:11:19, 83. Q. Yes. A. 3:14:02, 87. Q. Yes. A. 3:16:18, 89. Q. Yes. A. 3:18:40, 89. Q. Yes. A. All those are at 34.00 degrees Celsius. Q. Yes. A. Ah, April 4th, 2015 at 1:29:53. Q. Yes. A. Calibration check of 94. Q. Yes. A. The temperature was 34.03 degrees Celsius. Q. Yes, that’s an acceptable temperature?
A. Yes, 34 plus or minus 0.2 degrees Celsius, so .2 would be well within – the .03 would be well within the .2. Q. Right. A. 7:38:10. Q. Yes. A. 34 degrees Celsius, is - 95 is the value. Q. Yes. A. 7:49:49, 96, the temperature is 34 degrees Celsius. 8:30:52, 96. Q. Yes. A. 34 degrees Celsius. 9:40:46 is 96. Q. Yes. A. 34.00 degrees Celsius. Q. Yes. A. 9:40:46 – oh, same problem again. Q. 9:40:46. A. It’s the same – so it’s used – instead of having the actual time of the event, it’s used the time that the – the test was initiated. Q. Right. A. So, there’s a 95 and it’s 34 degrees Celsius. Q. Is there a 96 and a 95 in there? A. Yes. Q. All right. A. A 96 and a 95. Q. But they’re both – they both show as 9:40:46. A. Correct. Q. Right. A. 21:30:32.
Q. Yes. A. A 95 and the result is – 95 is the result and 34.00 is the temperature. Q. Right. A. 22:29:10, 94, and... Q. Yes. A. ...34 degrees Celsius. And then it switches over to April 5th, 2015 at 00:30:55 a 95 and 34 degrees Celsius. 1:02:48. Q. Yes. A. A 95 and 34.01 degrees Celsius, so that’s also within the acceptable range. Q. Yes. A. 1:18:37, 95, 34.01 degrees Celsius. Q. Yes. A. 1:18:37, 96 so we have that same problem again, where the time is the time of the subject data entry as opposed to the actual time of the actual occurrence of this step, and it’s 34.01. Q. Yes. A. 1:57:28, 96 and 34.01 degrees Celsius, that’s acceptable. Q. Yes. A. 1:57:28, 96 and 34.00. Q. Yes. A. 2:38:28, 95, 34.02 degrees Celsius. Q. Yes. A. Which is fine. 2:53:18, 96 and it’s 33.99 degrees Celsius. That’s also within the acceptable range. Q. Yes. A. 2:53:19, 96, 34.01. Q. Yes.
A. 4:03:20, 91, 34.01. Q. Yes. A. 5:00:25, 96. Q. Yes. A. 34.01. 5:25:57, 97. Q. Yes. A. 34.00. 5:25:57 is 97. Q. Yes. A. And it’s 34.01. 6:01:15, 97 and 34.01 is the temperature. Q. Yes. A. 6:01:15, 96, 34.01. Q. Yes. A. And now we’re switching dates. It’s now April 6th, 2015. Q. Yes. A. At 4:01:20, is 96 and 34.00 degrees Celsius. Q. Yes. A. 4:15:28, 98 and 34.00 degrees Celsius. Q. Yes. A. 4:15:28, same problem, the result is 99 and 34.00. Q. Yes. A. Now April 7th, 2015. Q. Yes. A. At 1:03:41, 93. Q. Yes. A. And 34.00 degrees Celsius. Q. Yes. A. 1:14:56, 96 and 34.00 degrees Celsius. Q. Yes.
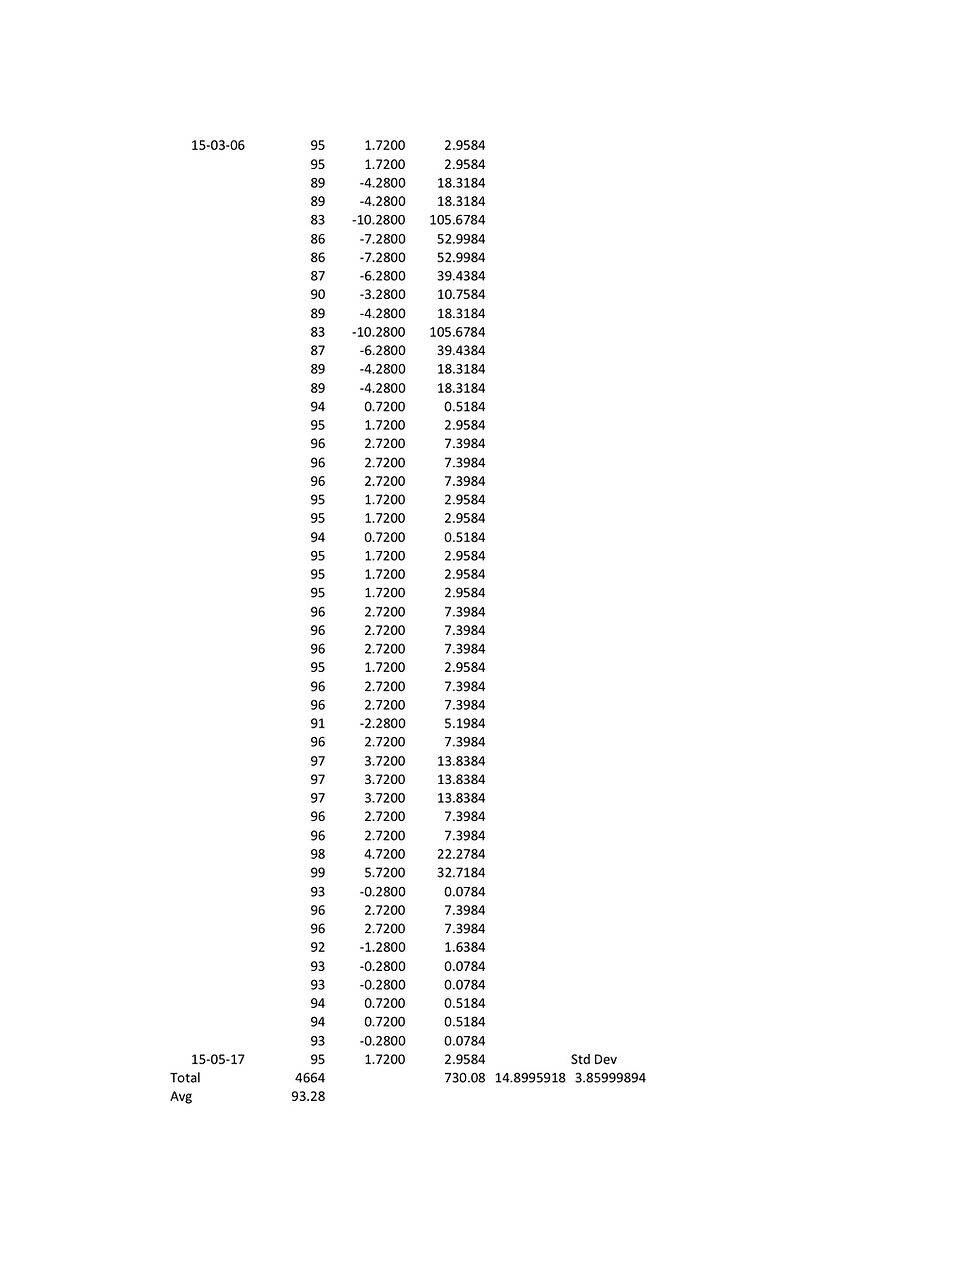
A. 1:14:56, again same issue, 96 and 34.02. The time is the same. We’re now at May 17th, 2015. Q. Yes. A. At 2:39:04, 92 and 34.00 degrees Celsius. Q. Yes. A. 2:43:12, 93 and 34.00. Q. Yes. A. 2:43:12, 93 and 34 degrees Celsius. Q. Yes. A. So, same problem with the – the time. Still on the 17th, 4:00:19, 94 and 34.00. Q. Yes. A. And then again, later on, 94 again, and 34.00 degrees Celsius. Q. Yes. A. And then this would be the test subject in question here. Q. Yes. A. At 4:13:08, 93 at 34.00 degrees Celsius. Q. Yes. A. And 4:13:08 at 95 and 34.00 degrees Celsius. Q. All right. So, the data in the spreadsheet that I’ve shown you. A. Yes. Q. I think all of us have gone through and checked it against what you read off, and the numbers seem to be consistent. A. Correct. Q. So, again, following the same methodology used by the Centre of Forensic Sciences, of taking 50 tests and then calculating accuracy in precision, in your case, in
the case of the Centre, the Centre goes much further and calculates measurement uncertainty, but for the purposes of calculating accuracy and standard deviation, we followed the methodology of collecting and looking at 50 control tests. A. You have, yes. Q. All at one – all at 100 milligrams per 100 mils. All with simulator temperatures that are where they should be. A. Yes. Q. All being done by – as far as we know, being done by qualified technicians. A. Yes. Q. Now.... A. These are in – at one of either two locations. Q. Yes. Either in the RIDE truck or at 4 District. A. Yes.

Q. Now if we take an average of all of those numbers, my total came up to 4,664 and if you divide by 50 that should be 93.28. A. Without a spreadsheet, I would not be able to confirm that. Q. Maybe we should double check that over lunch. But then in terms of calculation of the standard deviation, using the same methodology I used with respect to – that the instrument uses of taking – in other words, exactly the same methodology that the instrument uses, the number that I come up with is 3.859 as the standard deviation. A. I will accept your math. Q. All right, well we can double – we can double check that over lunch if you like, but my point is,
that the standard deviation, looking at that data, looking at a whole lot of data, the standard deviation is now well beyond 3 milligrams per 100 mils. It’s at 3.859 milligrams per 100 mils, way beyond the manufacturer’s specification for precision on its instrument. A. That is correct. However, you are using data points for that calculation that I would not use.
For discussion: Why shouldn't we use all this data in mathematically calculating the precision of an instrument that has suffered drift in precision? That's the whole point of "precision". Would an expert in statistics exclude the wonky data just because it is inconvenient?
